Presentations
|
|
| ||||||
Learning Resources
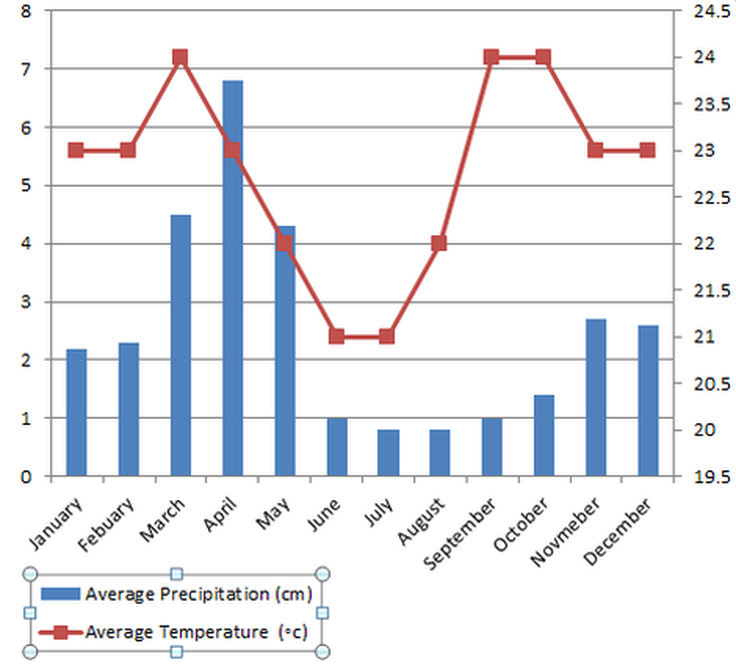
A climatograph is a special graph that shows how the climate of a certain location changes month by month averaged over many years.
Projects, Labs & Assignments
| biome & climatograph project |
